Homeassistant for Allergiker - Pollenflug information received
Introduction
A few years ago, my body decided that a pollen allergy would be a great idea. Since then, I have often been quite done in spring, summer and autumn and must sneeze all day. Since I have not grown up with these problems, I have never dealt with which pollen fly when and which one there is. Fortunately, Home Assistant can take my arms and show which pollen are represented when and in what strength. In this short post I would like to show you how to display the different pollen loads for your own residential area in Home Assistant.
Main part
To view data in Home Assistant, it is important to get it at all. For this we use the data of the German Weather Service. (https: / / www.dwd.de / DE / services / run index coils / run index poll.html).
Install Integration
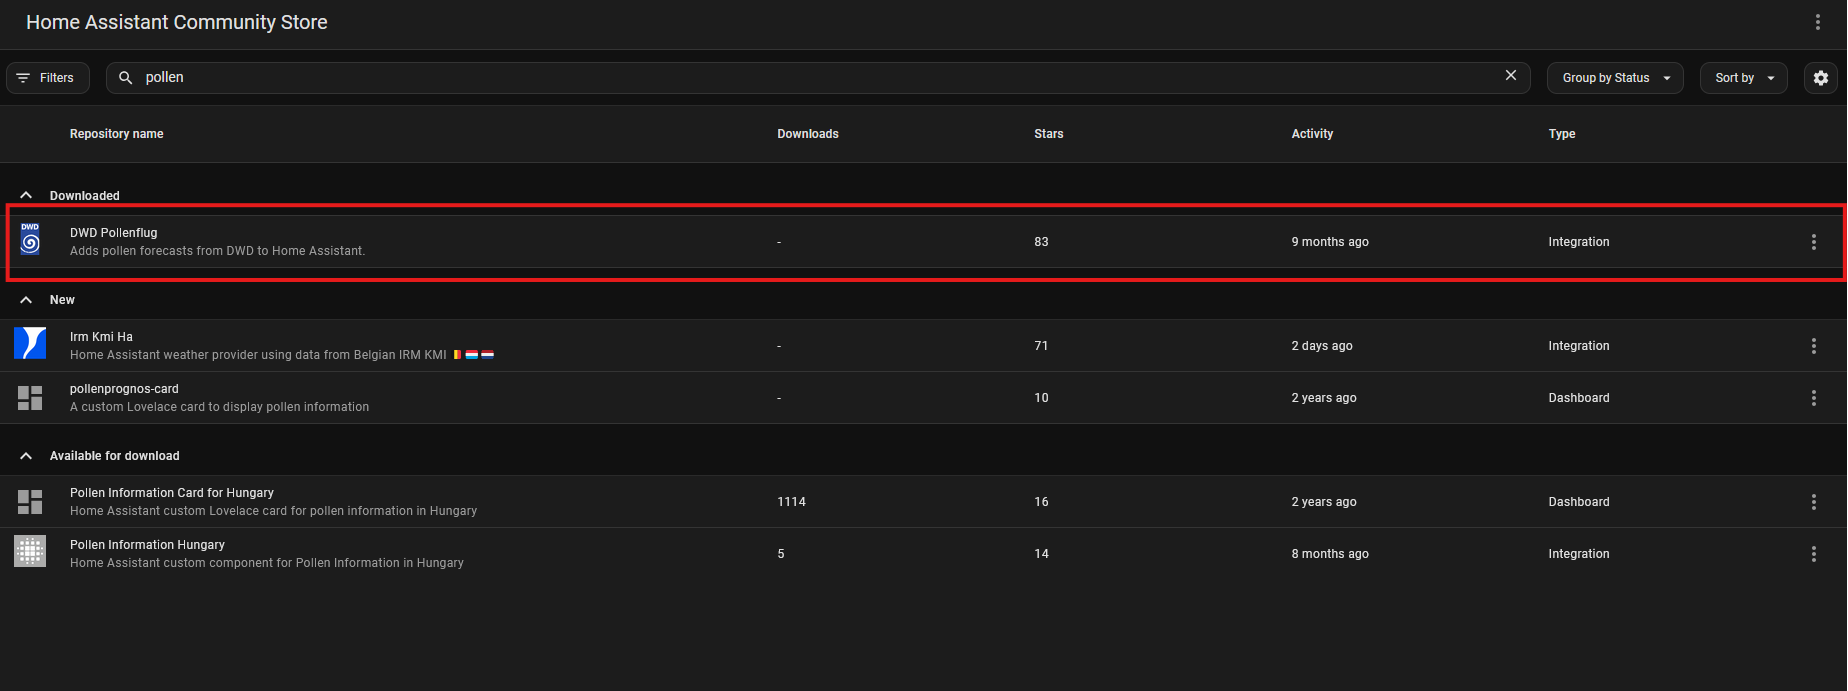
First, HACS is looking for "DWD." It should appear an integration called "DWD Pollenflug"
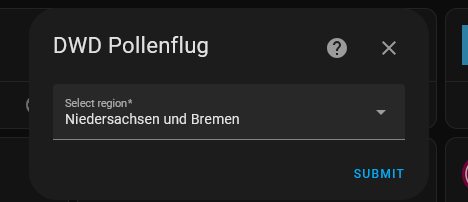
Once the integration is installed, we can use it on Settings > Devices & Services > Add Integration add and configure. To do this, simply search for the integration (DWD), install and specify the federal state and the corresponding subgroup during the configuration. It looks like this:
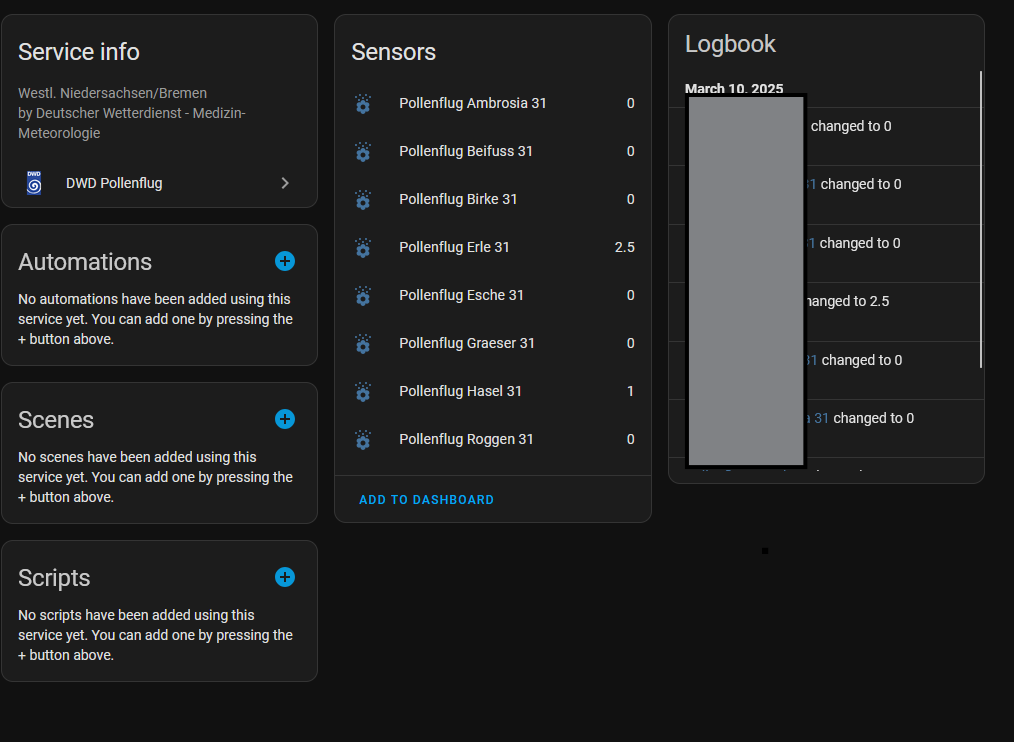
In the end you get 8 sensors with different pollen types. These are always displayed with an intensity index between 0 and 3.
A pollen flight of 0 stands for "No pollen load" and 3 for "high load." In fact, there are the following steps:
- 0 = > none
- 0.5 = > none to low
- 1 = > low
- 1.5 = > low to normal
- 2 = > medium
- 2.5 = > medium to high
- 3 = > high
Back…


